Top 10 Types of Industrial Solutions for Global Buyers?

Industrial solutions now shape how factories manage energy, production, maintenance, safety, and supply chains. Global buyers need more than equipment catalogs. They need systems that work reliably beside existing machines, under real operating pressure.

The International Energy Agency reports that industry consumed about 37% of global final energy in 2022. That figure makes efficiency a purchasing priority, not a marketing phrase. Deloitte’s 2025 Smart Manufacturing and Operations Survey found that 92% of manufacturers expect smart manufacturing to become a major competitiveness driver within three years. These findings explain why buyers increasingly compare automation, industrial Internet of Things platforms, robotics, energy management, cybersecurity, and predictive maintenance together. Each solution affects the others.

The ten categories in this outline reflect common purchasing decisions across factories, warehouses, utilities, and process industries. They include practical details, such as sensor compatibility, response time, installation limits, operator training, and after-sales support. Small details matter. A dashboard is useless if technicians cannot trust its alarms. A robot may increase output, but only when integration and worker safety are properly managed. The categories also overlap. That is intentional, although not always convenient. Real projects rarely fit one neat box.

Reliable selection requires evidence from technical specifications, independent testing, supplier references, and lifecycle cost analysis. The World Economic Forum’s Global Lighthouse Network also shows that leading facilities gain value by combining technologies with process redesign and workforce development. Technology alone is not enough. This guide therefore approaches industrial solutions from a buyer’s perspective, balancing measurable performance with implementation risks, regional requirements, and long-term serviceability.

Top 10 Types of Industrial Solutions for Global Buyers?

Define Industrial Solutions with the IEA’s 37% Industry Energy-Use Baseline

Top 10 Types of Industrial Solutions for Global Buyers?

Define Industrial Solutions with the IEA’s 37% Industry Energy-Use Baseline

The IEA’s baseline places industry at about 37% of global final energy use. That figure changes the buying question. Industrial solutions are not single products. They are practical systems that reduce energy, protect output, and improve operating control. Common categories include energy management, efficient motors, process heating, electrification, and waste heat recovery. Other options cover industrial automation, predictive maintenance, water treatment, emissions monitoring, and resilient infrastructure. Together, these ten areas address the factory floor, utility room, and production network.

An experienced buyer should request measured baselines, hourly load data, maintenance records, and realistic payback assumptions. Ask how a solution performs during shutdowns, seasonal demand, and partial production. Request commissioning evidence. Energy savings can look impressive on paper, yet poorly tuned controls may create unstable temperatures or rejected batches. That risk deserves attention. Suppliers should explain measurement boundaries, data quality, cybersecurity safeguards, worker training, and local compliance requirements. Independent verification strengthens confidence, especially when savings depend on several connected systems. Still, no baseline is perfect. Different sites measure energy differently, and older equipment often hides losses. Global buyers should leave room for uncertainty, test one production line, and revise the plan after real operating feedback. Practical results matter more than polished promises.

Classify Automation and Robotics Using IFR’s 541,302-Unit 2023 Record

Top 10 Types of Industrial Solutions for Global Buyers?

Classify Automation and Robotics Using IFR’s 541,302-Unit 2023 Record

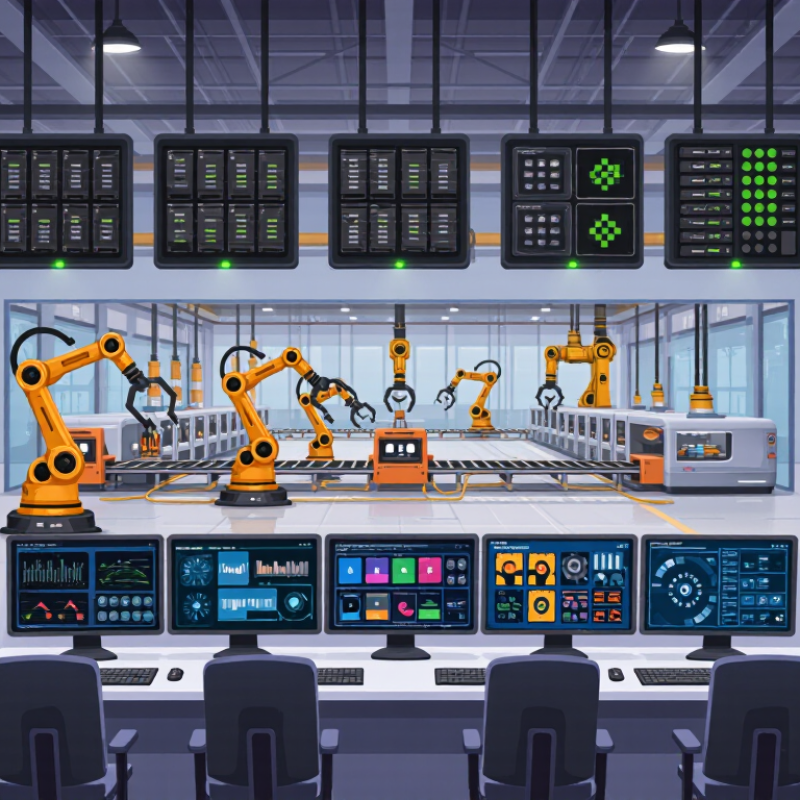
The International Federation of Robotics reported 541,302 new industrial robot installations worldwide in 2023. This record shows strong demand for measurable productivity. Buyers can classify solutions into ten practical types:

articulated robots, SCARA robots, delta robots, Cartesian systems, collaborative robots, mobile robots, autonomous mobile robots, automated guided vehicles, robotic vision systems, and integrated production cells.

Each type fits different tasks. Articulated robots handle welding and palletizing. SCARA systems suit rapid assembly. Vision systems inspect tiny defects under bright factory lighting.

In real purchasing work, installation figures are useful, but they do not explain every project. They count new installations, not total operating robots. Categories may also overlap. A mobile robot can carry a collaborative arm, creating a mixed solution. Buyers should compare cycle time, payload, reach, accuracy, floor space, operator training, and maintenance access. A robot may look efficient on paper. It can still fail when parts arrive inconsistently.

Tips: Request a sample process test before signing. Measure one complete shift, including changeovers and stoppages. Ask for service response times, spare-part availability, safety documentation, and integration limits. Keep a manual fallback for early production. That detail is often ignored. A realistic pilot may reveal slower handling, awkward loading, or software gaps before they become expensive problems.

Assess Energy, Water, and Circular Systems Against IEA Power Data

Industrial buyers need solutions that perform beyond a product brochure. Energy efficiency, onsite generation, battery storage, heat recovery, and power monitoring form five practical categories. Water treatment, process-water reuse, leak detection, and rainwater systems add three more. The tenth category is circular-material management, including repair, remanufacturing, and controlled recycling.

IEA power data provides a useful reality check. Recent outlooks show renewables and nuclear supplying most new global electricity demand through 2026. However, grid carbon intensity still differs sharply by region. A factory connected to a coal-heavy grid may gain more from efficiency and heat recovery than from a small solar installation. Buyers should compare kilowatt-hours saved, peak demand reduced, water withdrawn, and materials recovered. Use measured baselines, not optimistic estimates.

Field experience also exposes uncomfortable gaps. A water-reuse system can reduce withdrawals, yet increase electricity use for pumping and filtration. Battery storage may lower peak charges, but its embodied materials require careful assessment. Circular systems can fail when recovered materials lack stable buyers. That is not a reason to reject them. It is a reason to test contracts, maintenance skills, and end-of-life plans before scaling. Site audits, twelve months of utility data, and independent performance checks make comparisons more reliable. Small pilots help. They also reveal assumptions that spreadsheets hide.

Top 10 Types of Industrial Solutions for Global Buyers? — Assess Energy, Water, and Circular Systems Against IEA Power Data
Rank Industrial Solution Type Primary Buyer Need Energy Dimension Water Dimension Circular-System Dimension Relevant Benchmark or Indicative KPI Best-Fit Industrial Applications
1 Energy-Efficiency and Motor-System Optimization Reduce electricity costs, peak demand, and avoidable equipment losses. Energy
High impact in facilities using pumps, fans, compressors, conveyors, and machine tools.
Improves the efficiency of water pumping, aeration, cooling, and treatment systems. Extends equipment life and reduces replacement demand through condition-based operation. 10–30% electricity savings is a commonly reported engineering range for combined motor upgrades, variable-speed control, and system optimization. Electric motor systems account for approximately 53% of global electricity consumption according to an IEA market assessment. Manufacturing plants, water utilities, mines, warehouses, food processing, and district-energy systems.
2 Renewable Power, Storage, and Industrial Microgrids Lower exposure to grid price volatility and improve power resilience. Energy
Combines on-site solar or wind, batteries, demand response, and backup generation.
Supports reliable power for pumping, desalination, cooling, and wastewater treatment. Battery refurbishment, recycling, and renewable-equipment end-of-life planning should be included in procurement. Renewables supplied approximately 30% of global electricity generation in 2023, according to the IEA. Storage sizing should be based on load profile, renewable intermittency, and required backup duration. Remote facilities, industrial parks, cold chains, data-intensive plants, mines, ports, and critical infrastructure.
3 Industrial Heat Pumps and Process Electrification Replace fossil-fuel combustion in low- and medium-temperature processes. Energy
Uses electricity to deliver process heat with a coefficient of performance commonly around 3–5, depending on temperature lift and operating conditions.
Can reduce cooling-water demand when integrated with heat recovery and closed-loop thermal systems. Captures low-grade heat that would otherwise be rejected and reduces fuel-related emissions. Most suitable where heat demand is below approximately 120–160°C; higher-temperature applications require specialized equipment and site-specific assessment. Food and beverage, chemicals, textiles, paper, pharmaceuticals, district heating, and low-temperature drying.
4 Waste-Heat Recovery and Thermal Integration Recover useful energy from exhaust gases, hot liquids, steam, and cooling systems. Energy
Reduces fuel consumption by reusing heat for preheating, drying, steam generation, or nearby processes.
May reduce cooling-water demand by lowering the amount of heat rejected to cooling towers or once-through systems. Improves total resource productivity without requiring additional raw-material extraction. Industrial engineering references commonly estimate that 20–50% of industrial energy input can be lost as waste heat, although recoverable potential depends on temperature, contamination, and operating schedules. Metals, cement, glass, ceramics, chemicals, refineries, food processing, and thermal power facilities.
5 Industrial Water Reuse and Closed-Loop Process Water Reduce freshwater intake, discharge volumes, and exposure to water scarcity. Energy
Energy demand varies by treatment level; gravity-based reuse generally requires less energy than high-pressure membrane systems.
Water
Can reduce freshwater withdrawals and process-water demand by approximately 20–80% when multiple reuse loops are technically feasible.
Recovers water as a usable resource and reduces the need for treatment chemicals and new intake infrastructure. Agriculture represents approximately 70% of global freshwater withdrawals; industrial buyers should therefore assess water projects against local basin stress rather than global averages alone. Textiles, semiconductors, food processing, chemicals, mining, power generation, and industrial parks.
6 Advanced Wastewater Treatment and Nutrient Recovery Meet discharge limits while recovering water, nutrients, and energy from wastewater. Energy
Energy intensity depends on biological treatment, membranes, aeration, pumping, and sludge processing.
Water
Enables treated effluent reuse for cooling, cleaning, irrigation, or process applications.
Circular
Potential recovery streams include biogas, phosphorus, nitrogen, biosolids, and reusable water.
More than 80% of wastewater is estimated to be discharged without adequate treatment globally, according to UN water assessments. Local regulations and contaminant profiles determine the required treatment train. Municipal-industrial interfaces, food processing, chemicals, pulp and paper, mining, and livestock operations.
7 Material Recovery, Recycling, and Secondary-Raw-Material Systems Reduce virgin-material purchases, landfill exposure, and embodied emissions. Energy
Secondary materials often require less processing energy than primary production, but savings differ significantly by material and contamination level.
Can reduce water use associated with mining, refining, pulp production, and primary chemical processing. Circular
Prioritizes sorting, remanufacturing, recycling, and quality preservation of materials.
Global material extraction reached approximately 100 billion tonnes per year in the late 2010s, while the global economy was estimated to be only about 7.2% circular in 2023. Metals, plastics, construction materials, electronics, packaging, automotive components, and industrial equipment.
8 Industrial Symbiosis and By-Product Exchange Convert one facility’s waste, heat, water, or by-products into another facility’s input. Energy
Shared heat, steam, power, and utility infrastructure can reduce duplicated generation capacity.
Shared treatment and reclaimed-water networks can reduce freshwater intake and discharge loads. Circular
Supports cross-sector use of slag, ash, waste gases, organic residues, solvents, recovered minerals, and surplus heat.
Performance must be measured through verified material-flow balances. Suitable exchanges should meet quality, safety, transport, and regulatory requirements. Industrial parks, ports, chemical clusters, steel and cement zones, food-processing clusters, and municipal-industry networks.
9 Anaerobic Digestion and Organic-Resource Recovery Process organic waste while producing biogas, heat, electricity, or biomethane. Energy
Biogas typically contains approximately 50–70% methane; actual energy yield depends on feedstock and digester performance.
Reduces the liquid and organic load requiring conventional wastewater treatment when properly integrated. Circular
Returns carbon and nutrients to productive use through digestate management and controlled soil application.
Feedstock quality, methane leakage control, digestate quality, and end-use efficiency should be included in the buyer’s business case. Food and beverage, municipal organics, agriculture, livestock, wastewater treatment, and agro-industrial facilities.
10 Digital Energy, Water, and Asset-Performance Management Create a verified data layer for energy, water, emissions, maintenance, and resource flows. Energy
Combines sub-metering, automation, analytics, demand forecasting, and fault detection.
Water
Detects leaks, abnormal consumption, pressure losses, and treatment-performance deviations.
Improves traceability of materials, maintenance parts, waste streams, and product life-cycle data. Energy-management programs commonly target approximately 5–15% initial energy savings through measurement, operational control, and continual improvement; results depend on baseline quality and implementation discipline. Multi-site manufacturers, utilities, warehouses, process plants, campuses, and energy-intensive infrastructure.
Data basis: Global context indicators are synthesized from publicly reported data by the International Energy Agency, United Nations water assessments, FAO water statistics, and circular-economy material-flow studies. Performance ranges are indicative engineering benchmarks, not guaranteed project outcomes. Actual results depend on site conditions, climate, operating load, local regulation, feedstock quality, and system design.

Evaluate Digital, Cybersecurity, and AI Tools Using IoT Market Forecasts

Industrial buyers are increasingly comparing digital platforms, cybersecurity systems, and AI tools through IoT market forecasts. These forecasts reveal adoption trends, device growth, connectivity demand, and expected investment. They do not guarantee business value. A precise-looking projection can still mislead if it ignores regional infrastructure, workforce skills, or data regulations.

In practical evaluations, buyers should connect forecasts with measurable operating needs. A factory may need vibration sensors that detect bearing wear before a line stops. A logistics operator may require encrypted device communication and rapid anomaly alerts. AI tools should explain unusual predictions, not simply produce impressive scores. Check data ownership, model update policies, access controls, and recovery procedures. Request a controlled pilot with real production data. Test before scaling.

Tips: Compare at least three independent forecasts. Separate market enthusiasm from verified performance. Ask vendors for audit records, uptime evidence, and failure examples. Measure response time, false alerts, energy use, and training costs. Cybersecurity is ongoing, not a one-time purchase. It needs patch schedules, identity management, network segmentation, and staff awareness. Keep human review for high-impact decisions. That gap matters. A tool may pass a demonstration yet struggle with dusty sensors, unstable networks, or incomplete records. Buyers should document these weaknesses instead of hiding them. Forecasts should guide planning, while field evidence should control final decisions.

Compare Logistics and Safety Solutions with ISO, GHG, and LPI Metrics

Top 10 Types of Industrial Solutions for Global Buyers

Industrial buyers usually compare ten solution areas: freight planning, warehousing, tracking, customs documentation, packaging, worker protection, emergency response, asset monitoring, training, and environmental reporting. Logistics performance should be measured beyond delivery speed. The Logistics Performance Index, or LPI, examines customs efficiency, infrastructure, shipment quality, tracking, timeliness, and logistics competence. These indicators help buyers identify delays at ports, weak handovers, and unreliable transport partners.

Safety solutions need equally practical evidence. ISO-based management systems can support risk assessment, incident control, training records, and corrective actions. Buyers should request audit results, equipment inspection logs, and response-time data. A clean certificate alone proves little. Site conditions matter. A warehouse may meet documented procedures but still contain blocked exits or poorly marked walkways.

Greenhouse gas reporting adds another comparison layer. Transport emissions can be estimated by fuel use, distance, cargo weight, and shipment mode. Scope 1 and Scope 2 data are often easier to verify than selected Scope 3 categories. That gap deserves attention. Suppliers should explain calculation boundaries, emission factors, and missing data instead of presenting false precision. In practice, one delayed truck can create extra storage, energy, and handling emissions. Small operational details matter. Buyers can compare LPI results, ISO controls, safety records, and GHG intensity in one procurement scorecard, while allowing room for local risks and incomplete evidence.